The 3 reasons why Docker got it right

Containers have been around for a while. But why did they finally get their well deserved popularity only with the rise of Docker? Was it just a matter of market maturity, or something else? Having worked at Joyent, I had the luck of being in the container business before Docker was even invented, and I would like to give you my take on that.

A brief history of containers

We hear this again and again in compute science: what we think has been recently invented by some computing visionary has actually its roots typically decades ago. It happened with hardware virtualisation (emulation), with the cloud client-server de-centralization (mainframes) and, yes, also with containers.

If you also started to hack with Unix back in the early 90’s you’ll certainly remember chroot. How many times I’ve used that to make sure my process wasn’t messing around with the main OS environment. And you’ll probably remember FreeBSD jails, that was adding all that required kernel-level isolation to implement the very first OS-level virtualisation system.

Sun Microsystem also believed strongly in containers and developed what they called “zones“, definitely the most powerful and well thought container system. But despite Sun believed in containers more than it did on hardware level virtualisation, the market moved towards the latter, not because it was the right approach but simply because it allowed the guest OS to stay untouched. Unfortunately Sun never managed to see much of the results of zones as nobody knows what really happened to them after the acquisition from Oracle. Luckily another company, Joyent, picked up the legacy of OpenSolaris with its SmartOS derivative. SmartOS is now used as the foundation of the Joyent Cloud with an improved version of zones at the very core of it.

At the same time, yet another company, Parallels (now Odin), stewarded OpenVZ, a Linux open-source project for OS-level virtualisation. The commercial version of it was called Virtuozzo and Parallels sold it as their virtualisation system of choice.

Since late 2000’s, Joyent and Parallels have been pioneering the container revolution but nobody talked about them as much as it’s now being done for Docker. Let’s try to understand why.

Positioning of containers

The easy conclusion would be that the market wasn’t just ready yet. We all know how timing is important when releasing something new and I’m sure this also played a role with containers. However, in my view, that’s not the main reason.

Let’s look at how these two companies were selling their container technology. Joyent made it all around performance and transparency: if you’re using a container instead of a virtual machine (i.e. hardware level virtualised) you can get an order of magnitude of performance increase, as well as total transparency and visibility of the underlying hardware. That’s absolutely spot on and relevant. But apparently it wasn’t enough.

Parallels made it all around density. Parallels’ target market was hosting companies and VPS providers, those who’s selling a single server for something like four bucks a month. So, if you’re selling a container instead of a virtual machine, you’ll be able to squeeze twice or three times the amount of servers on the same physical host. Therefore you can keep your prices lower and attract more customers. Given that you’re not reserving resources to a specific container, higher density is a real advantage that can be achieved without affecting performance too much. Absolutely true but again, it did not resonate too loud.

The need to lower the overhead

In the last few years, we also witnessed the desperate need to lower the overhead. Distributed system caused server sprawl. Thousands of under utilised VMs running what we call micro services, each with a heavy baggage to carry: a multi-process, multi-user full OS, whose features are almost totally useless to them. Therefore the research in lowering the overhead: from ZeroVM (acquired by Rackspace) to Cloudius Systems, that tried to rewrite the Linux kernel, chopping off those features that weren’t really necessary to run single process instances.

And then came Docker

Docker started as delivery model for the infrastructure behind the dotCloud PaaS, it was using containers to deliver something else. It was using containers to deliver application environments with the required agility and flexibility to deploy, scale and orchestrate. When Docker spun off, it added also the ability to package those environment and ship them to a central repository. Bingo. It turned containers as a simple mean to do something else. It wasn’t the container per se, it was what containers unlocked: the ability to package, ship and run isolated application environments in a fraction of a second.

And it was running on Linux. The most popular OS of all times.

Why Docker got it right

All of this made me think that there are three main reasons behind the success of Docker.

1. It used containers to unlock a totally new use case

The use case that container unlocked according to Joyent, Parallels and Docker were all different: performance of a virtual server in the case of Joyent, density of virtual servers in the case of Parallels and application delivery with Docker. They all make a lot of sense but the first two were focused on delivering a virtual server, Docker moved on and used containers to deliver applications instead.

2. It did not try to compete against virtual machines

Joyent and Parallels tried to position containers against virtual machines. You could do something better with containers when using a container instead of a virtual machine. And that was a tough sale. Trying to address the same use case as what everybody already acknowledged as the job of a VM was hard. It was right but it would have required much longer time to establish itself.

Docker did not compete with VMs and, as demonstration of that, most people are actually running Docker inside VMs today… even if Bryan Cantrill (@bcantrill), CTO of Joyent, would have something to say about it! Docker runs either on the bare metal or in a VM, it does not matter much when what you want to achieve is to build, package and run lightweight application environments for distributed systems.

3. It did not try to reinvent Unix but used Unix for what it was built for

Docker didn’t try to rewrite the Linux kernel. However it fully achieved the objective to reduce overhead. Containers can be used to run a single process with no burden to carry an entire OS. At the same time, the underlying host can make best use of its multi-process capabilities to effectively manage hundreds of containers.

Don’t get my wrong. I absolutely believe about the superiority of containers when compared to virtual machines. I think both Joyent and Parallels did an amazing job spreading out their benefits like no other. However, I also recognise in Docker the unique ability to have made them shine much brighter than anyone has ever done before.

In conclusion, co-opting with the established worlds of virtual machines and Linux to exploit the largest reach, while adding fundamental value to them was the reason behind Docker’s success. At the same time, looking at containers from an orthogonal perspective, not as the goal but as a mean to achieve something different than delivering a virtual server, is what landed containers on the mouth of everyone.

SmartOS improves Node.js debugging experience (part 2)

This blog post is a two-parts series about debugging Node.js applications. The first part focuses on post-mortem debugging tools and practices, the second part illustrates how to debug latency bubbles in production using DTrace.

Debugging Node.js latency bubbles

Soft real-time systems

One thing that came out with Node.js is that it is extremely good for the new breed of applications: Internet facing, soft real-time systems.

A real-time system is one where the timeliness of the system is also its correctness, at some level. There is a clear distinction between hard real-time systems, where being late means failing, and soft real-time systems, where being late means systems just kind of “suck”.

With the rise of mobile, social and HTML5, we’ve seen more and more of this new breed of applications – DIRTy systems (data intensive real-time systems) – that are Internet facing, real-time systems that have a human in the loop. And when humans are in the loop the good news is that deadlines are soft (the system sucks but it doesn’t die – people will just complain), but the bad news is that the demand is typically non-linear.

Let’s imagine you’ve carefully built your real-time mobile application and suddenly a DJ from Cleveland tells all his listeners that they gotta go download your app and… boom! You get 100,000 people show up the same night, 400,000 more people at the end of the week and 1 million people at the end of the month. This happens, it has happened repeatedly, and it will happen again. We are seeing this trend accelerating, and the more computers will be in our pockets, the more we will have to cope with this.

And this is why it’s extremely difficult to deal with the challenge of scalability at the same time with the challenge of delivering data in real-time.

Debugging latency with DTrace

How do you debug these systems when they go wrong? How do you debug the latency bubbles that consist of failures in these kinds of systems?

Bryan Cantrill (@bcantrill) worked extensively in building real-time systems during his career and debugging them has always been a challenge for him. So he developed DTrace to dynamically instrument those systems, being able to walk them while they’re running, grabbing timestamps at different parts of the stack and correlating them to figure out where the latency is coming from.

The question was: how could we take DTrace into Node.js?

As was true for interpreting core dumps, in interpreted environments it’s extremely difficult to figure out from the bottom what is going on at the top of the stack. Bryan and team had a bunch of ideas and one of them was taken from other interpreted environments that instrument the actual VM wherever it’s doing a function call. It’s great and powerful (Erlang did a terrific job on that) but it is too fine grained.

Eventually, they decided to add USDT (Userland Statically Defined Tracing) probes at certain points of interests like HTTP requests, HTTP responses, GC and so on.

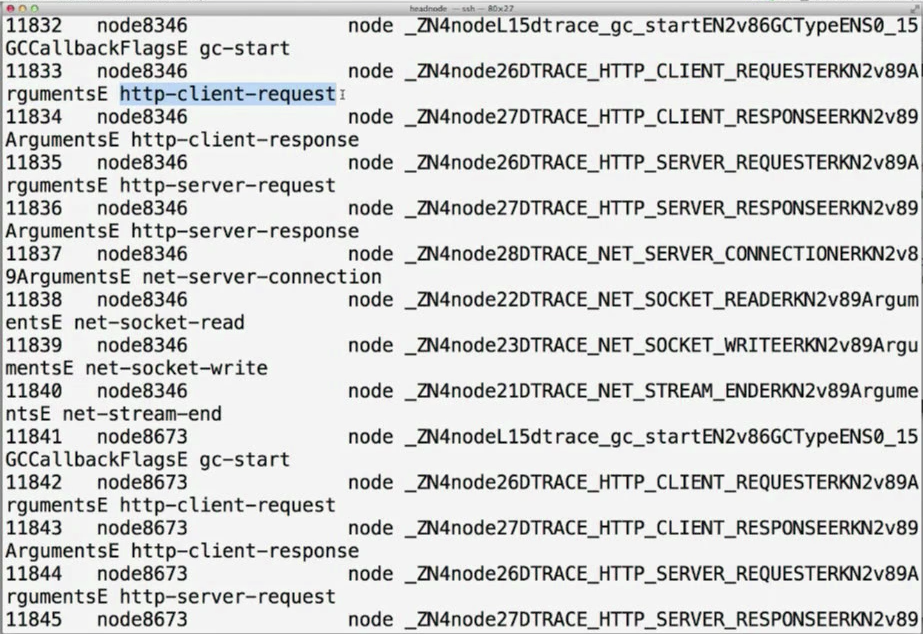
But how can we effectively use DTrace to debug our latency in Node.js? Let’s start by listing all the probes available for all my node processes by typing the following command in a SmartOS shell:

dtrace –n –l node*:::

And we’ll get an output like this:

SINDE Part 2 SC 1

Apart from the C++ name mangling, you can actually see the points of interests (USDT probes) named http-client-request, http-client-response, etc.

Let’s go enable all of them so that we can see in real time what our node processes are doing.

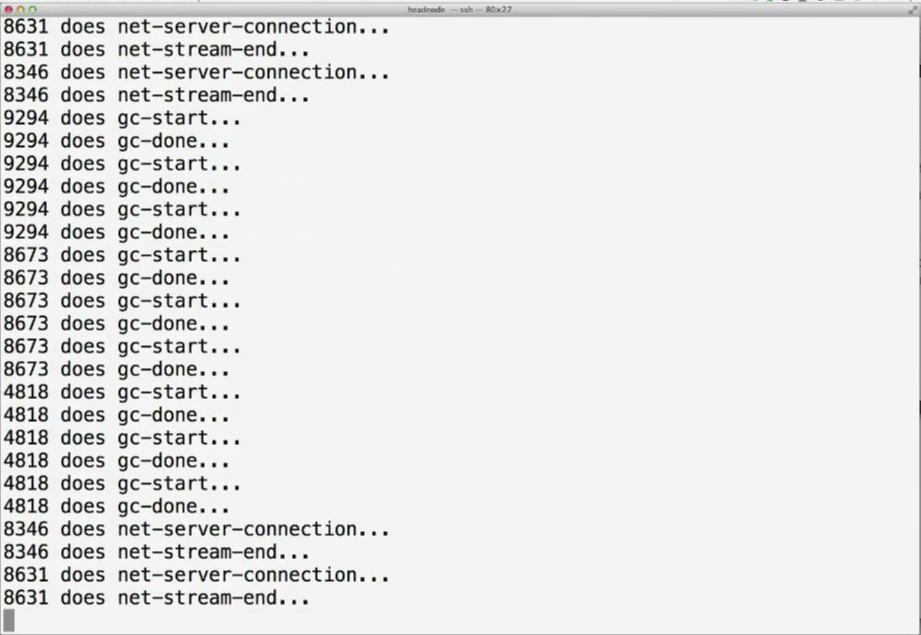
[root@23c5d173-9973-4d7c-8935-46c6-23ef47a6 ~]# dtrace –n node*:::’{printf(“%d does %s…n”, pid, probename)}’ –q

On the left you can see the process IDs and on the right what they’re doing:

SINDE Part 2 SC 2

Let’s try to isolate the incoming HTTP activity by instrumenting only the http-client-request:

[root@23c5d173-9973-4d7c-8935-46c6-23ef47a6 ~]# dtrace –n http-client-request’{printf(“%d does a %s to %s on %s”, pid, args[0]->method, args[0]->url, args[1]->remoteAddress)}’ –q

And we get some more information out of it:

SINDE Part 2 SC 3

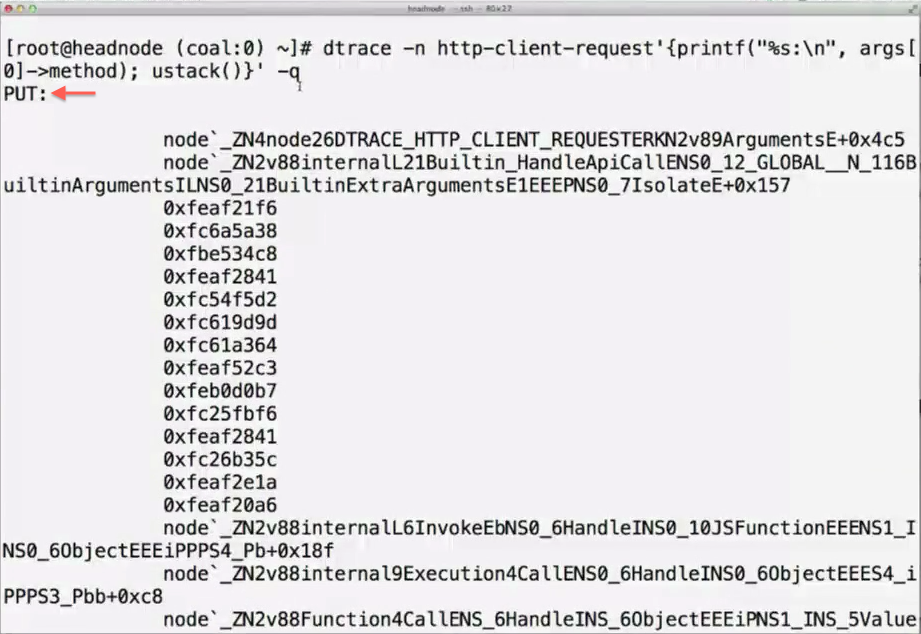
If we want to see the code actually executed upon HTTP requests, we can generate a stack trace whenever they occur by using the ustack() function:

[root@23c5d173-9973-4d7c-8935-46c6-23ef47a6 ~]# dtrace –n http-client-request’{printf(“%s:n”, args[0]->method); ustack()}’ –q

That prints out the stack backtrace:

SINDE Part 2 SC 4

We printed the actual called method “PUT” (args[0]->method) and right after the stack trace of what was executed upon the request.

But we’re now back to the other problem: what the hell is this? Bryan and team were in front of another challenge: how to turn all of this into V8 frames from the context of the kernel?

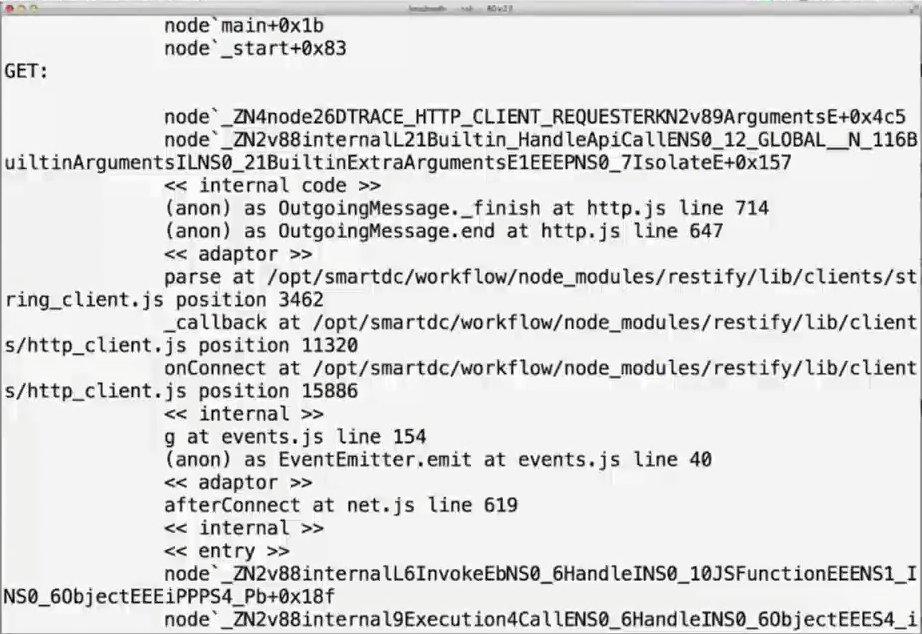
And Dave Pacheco (@dapsays), who doesn’t know the definition of impossible (see part 1 of this blog post), has solved this for JavaScript environment. This is how: when V8 starts, it expresses in an intermediate representation how to take one of these frames and turn it into an actual string, and all of that is downloaded into the kernel upon start of the virtual machine. Then, whenever there is a stack trace generated, this time by the jstack() function, the map table is evaluated and frames are turned into proper readable ones.

[root@23c5d173-9973-4d7c-8935-46c6-23ef47a6 ~]# dtrace –n http-client-request’{printf(“%s:n”, args[0]->method); jstack()}’ –x jstrackstrsize=8k –q

Now we can see the actual JavaScript that was executed upon a GET:

SINDE Part 2 SC 5

As you may have realized, this is shining a very bright light to what was previously a total black hole. If you have a Node.js program misbehaving without this kind of technology you’re hosed.

During Node Summit back in January 2012, we heard practitioners talking about big problems of Node.js, and it was all about production debuggability. This is what Joyent has invested a lot into with SmartOS, even if the truth is that we did it to debug our own problems, and that’s true also for DTrace!

The remaining challenge was that USDT methodology was difficult to use with JavaScript. Fortunately, Chris Andrews developed the Node.js DTrace provider that allows you to define your own probes (the “points of interest”) entirely using JavaScript.

All of the above is available in Node.js since 0.6.7 and it’s there by default, you don’t have to do anything to enable it.

Visualizing latency

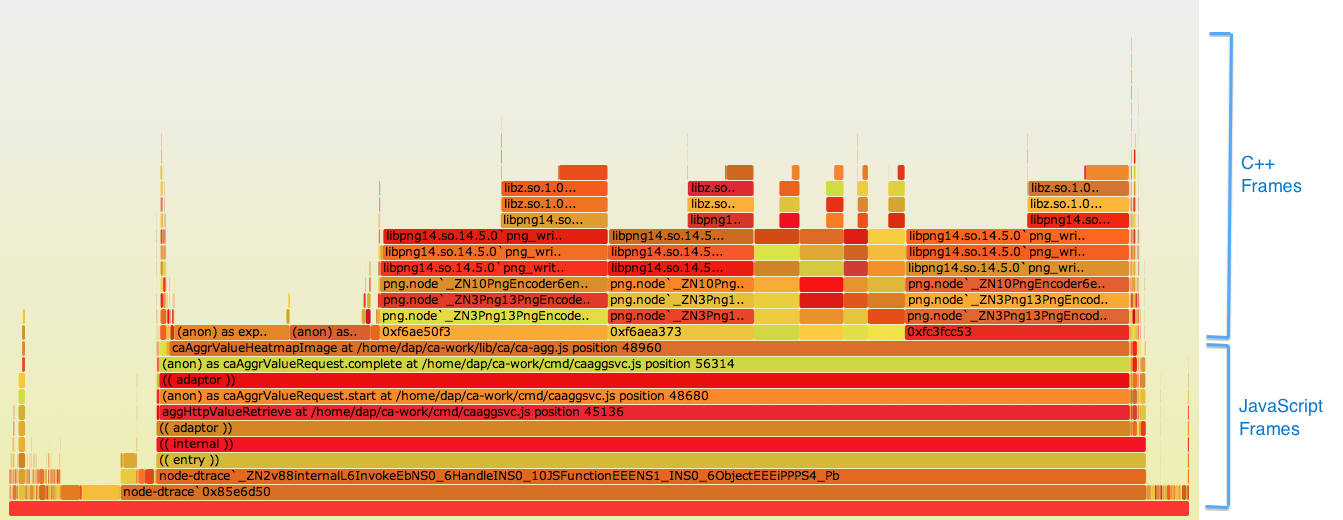
In terms of visualizing latency, another colleague from Joyent – Brendan Gregg (@brendangregg) – has done a terrific job. One of the most common problems is Node.js programs using too much CPU. Brendan hunted it by profiling the CPU at regular intervals, taking the stack traces, aggregating them by smashing the results together, re-sorting and displaying them as a “flame graph”:

SINDE Part 2 SC 6

The stack shows both JavaScript and C++ frames in a way you can easily identify where your program is spending most of the CPU time. And it’s good to know is that all the tools to generate flame graphs are on GitHub and they’re open source, you can already use them in production to find important bugs or latency bubbles throughout your Node.js code.

Conclusion

SmartOS is Joyent’s foundation for the NodeStack, but Node.js runs everywhere. We, at Joyent are not binding Node.js to work only on a particular platform. We’re committed to invest further in SmartOS in a way to make it the natural choice for your production Node.js environment. And we’re going to do this by giving you great technology that allows you to understand your Node.js app in a way you can’t on any other platform.

SmartOS is an open-source project and it can be consumed as-a-service on top of the Joyent Public Cloud where all the above mentioned tools are enabled by default.

But now I would like to hear from you: how you debug your Node.js applications today? Do you consider debugging in production being one of the biggest Node.js challenges?

End of part 2. You can watch all NodeStack videos, including the one by Bryan Cantrill that was summarized here, by registering yourself for free on the conference website.

SmartOS improves Node.js debugging experience (part 1)

This blog post is a two-parts series about debugging Node.js applications. The first part focuses on post-mortem debugging tools and practices, the second part illustrates how to debug latency bubbles in production using DTrace.

Recently I was a spectator of one of the very first online conferences about the rise of a new software stack built for mobile and web applications. The new stack is NodeStack and is comprised of Node.js, MongoDB and SmartOS.  It is intended to replace the now surpassed LAMP stack, as modern applications have to deal with real-time response delivered at scale, required when interacting with an exploding number of mobile devices.

NodeStack conference featured a fabulous talk by Bryan Cantrill (@bcantrill), Joyent SVP of Engineering, going through why Joyent’s operating system, SmartOS, really makes a difference within the stack.  His points were so prescient, or His talk was so good that I decided to give my contribution translating it into this blog post. If debugging your Node.js apps in production sounds like a dream come true, read on!

SmartOS, the foundation of the NodeStack

Does the foundation really matter? It’s often very tempting to dismiss the foundation and concentrate on the appearance of things but, just like with buildings, the foundation is really critical and it doesn’t necessarily matter when things are working as much as when things fail.

When your program fails you need the foundation – the Operating System – to really understand what happened. When your component has failed, it’s gone and all that’s left is inside the Operating Systems, like footprints on what used to be the component.

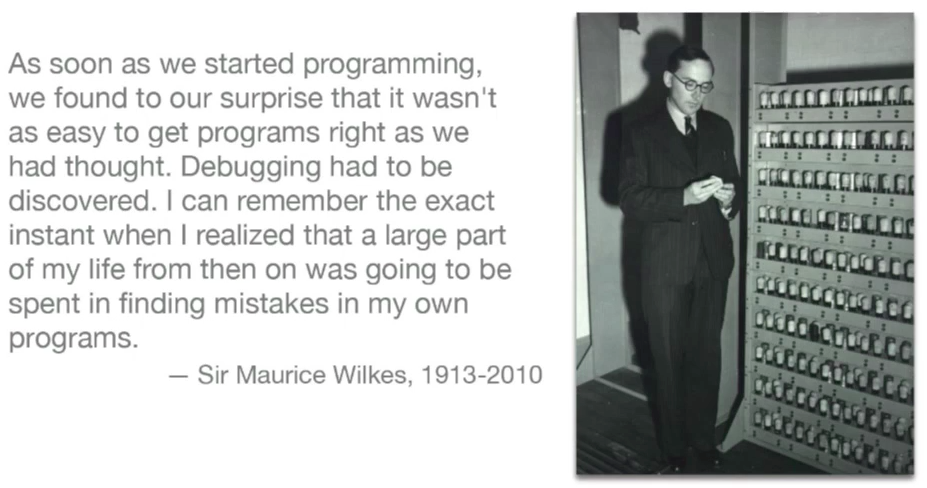
Sir Maurice Wilkes, the father of computing, built the first stored program computer back in 1949. The first programmer in history already realized that it wasn’t easy to get programs right.

SINDE Part 1 SC 1

SmartOS is Joyent’s open-source operating system, it is a derivative of illumos, the community driven fork of OpenSolaris that was born when the project was made proprietary. It is backed by many former Sun Microsystems engineers, and it is built to be the operating system for the cloud. You may want to check out www.smartos.org to get more information.

Debugging Node.js logic failures

First off, programs fail for internal logic errors. A bug can cause them to die, exit improperly or end up in infinite loops. To debug these kinds of failures you often need tight integration with the underlying OS.

A real use case

To give real examples, Bryan speaks to his own experience, since Joyent builds its entire software for orchestrating their cloud using Node.js. In the past, Bryan and his team, including Ryan Dahl (the creator of Node.js) and Dave Pacheco (@dapsays), were hitting a black hole by experiencing a non-systematic infinite loop inside their application right before deploying in production.

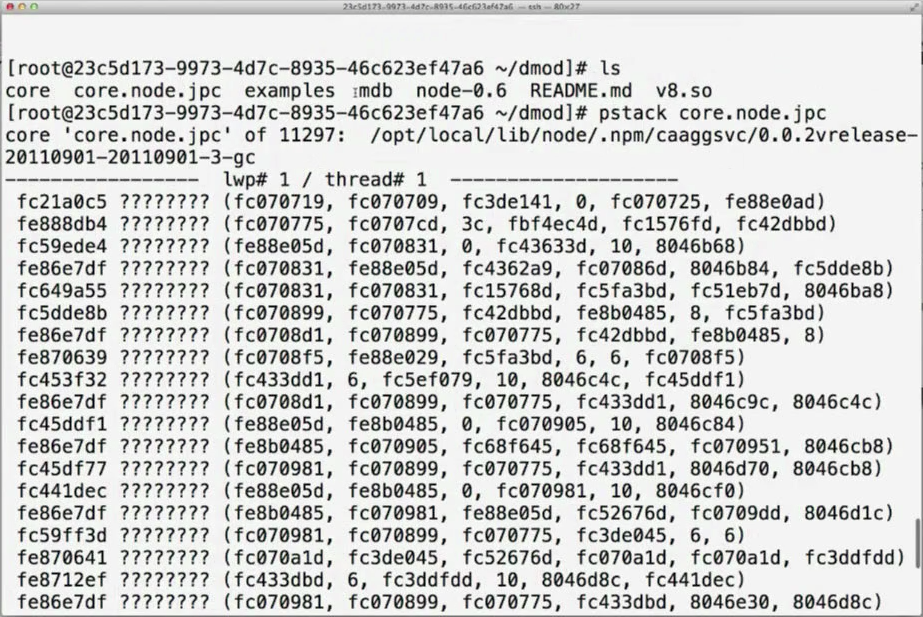
They were looking at the generated stack, which looked like this:

SINDE Part 1 SC 2

Obviously, you have no idea where you are in the code.

They eventually deployed the application in production and even though they expected to see the bug happening immediately, they didn’t see it for months. And here comes the difference between an amateur and a professional: an amateur happily says “the bug just went away!” while the professional knows that the bug is there and will hit him in his weakest moment. In fact, the bug actually appeared when a customer was watching a demo of the software.

Bryan and team decided they would have to write something new to help debug the software.

mdb and v8.so

Historically, we have always looked at core dumps for post-mortem debugging. It’s a very old idea commonly used to debug operating systems, databases, web servers, etc. It is really great because it allows for asynchronous debugging: after a failure, you can restart your system immediately and debug it in parallel.

The problem is that this has not worked well in interpreted environments.

The challenge for Bryan and team was to add support for post-mortem debugging for Node.js. Bryan thought it was basically impossible because it implies you are able to reconstruct the VM state.  From the bottom of the system (the Operating System), it is very difficult to determine what is happening further up the stack. And this is reinforced by the fact that no one has done it satisfactorily so far, neither Java, nor Python, Ruby, Erlang or PHP.  Bryan thought it was an impossible problem to solve. Dave Pacheco proved him wrong.

Among the anecdotes contained in The Soul of a New Machine by Tracy Kidder, there is one about a college hire joining an engineering team.  The senior engineers didn’t have time to look after him, so they gave him an impossible problem to solve (a simulator), just to make him kill some time.  But he came back after a couple of months saying, “the simulator’s done”. To their surprise, the senior engineers realized they didn’t tell him it was an impossible problem. He solved it because he didn’t know it was impossible.

In the same way, Dave Pacheco solved the problem of visualizing a stack trace for interpreted environments. The result is that now we have the v8.so dmod for mdb that can be used for debugging Node.js programs post-mortem.

Let’s take a look at how it works.

[root@23c5d173-9973-4d7c-8935-46c6-23ef47a6 ~/dmod]# mdb corefile
> ::load v8.so
> ::jstack

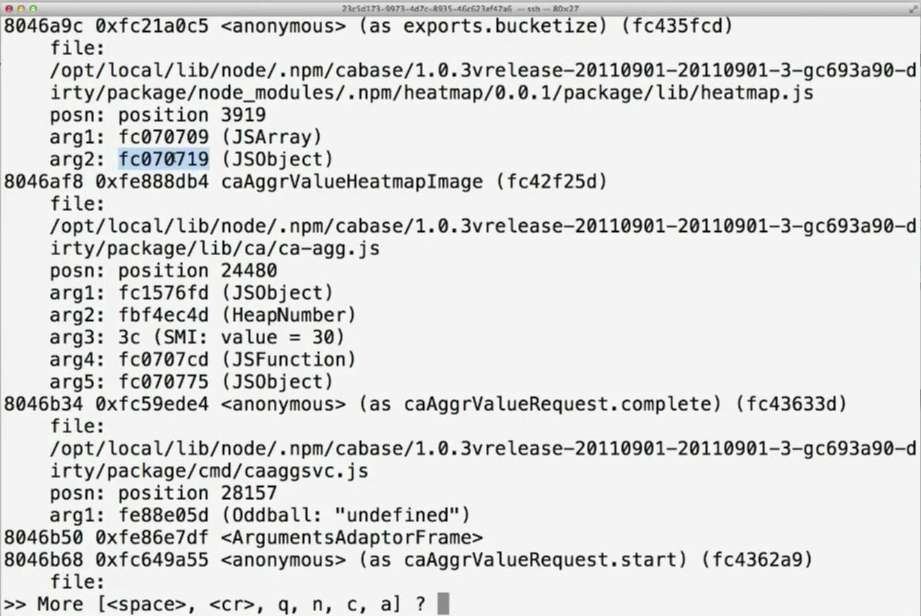
After loading v8.so, the stack trace we have seen before looks like this, displaying all the actual JavaScript frames:

SINDE Part 1 SC 3

Now it is definitely much easier to identify that the source of the problem is inside the heatmap.js file.

But Dave went one step further. With his dmod, we can also take an arbitrary object and see what the actual arguments are, printed out as JSON. Now, if you look at the following output, you will notice something a bit suspicious, considering that the pathology was an infinite loop.

SINDE Part 1 SC 4

Note that “min” and “max” have the exact same value. The heatmap.js shouldn’t be called with such parameter values but, at the same time, the function should be able to handle this situation without generating an infinite loop. Both the caller and the called were fixed.

This is a concrete example of how to understand a production problem that couldn’t be debugged in any other way than with an effective post-mortem debugging tool.

Memory leaks

“Where is my memory going?” – during the broad adoption of Java in the mid 90’s, we’ve seen the rise of garbage collector problems. Since then, programmers still see their programs spending too much time doing GC. But that happens either because of actual garbage collection or because you’re actually not generating any garbage. In the second case, it means you’ve got a semantic leak: a data structure that you don’t care about that still has a reference somewhere and GC can’t collect it. You will focus on GC as the cause of the problem when it’s just a symptom of the problem. And it’s very easy to keep implicit references in JavaScript that result in heap growth that you don’t know where it’s coming from.

Walking the memory to find the source of leaks is not an easy task, but Dave helped solve another impossible problem. Bryan and team did it by scanning all memory looking for objects that were satisfying all the constraints that a proper JavaScript object should have.

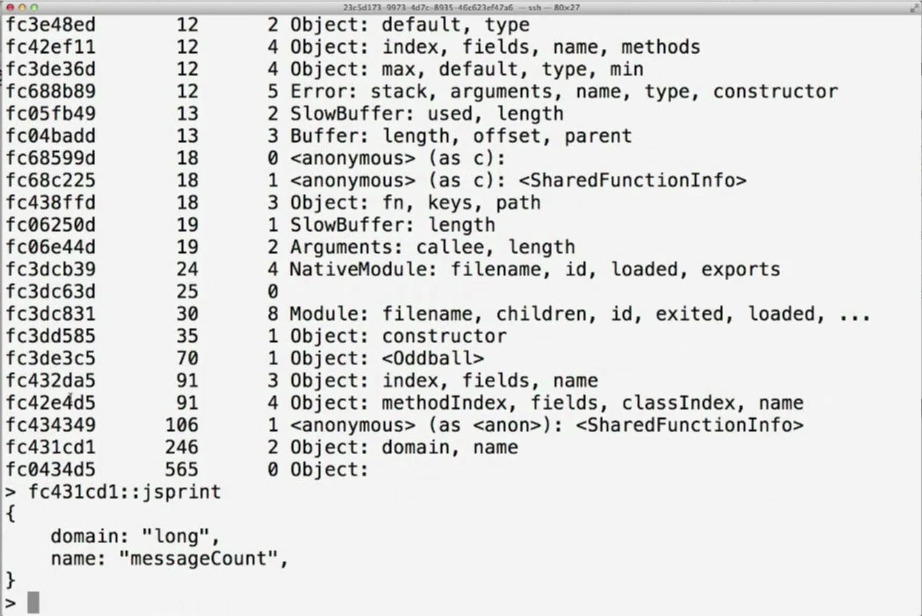
The result is the ::findjsobjects mdb command, which scans the core file and prints out all the objects that are recognized and that can be visualized by piping their address into ::jsprint.

SINDE Part 1 SC 5

But to go hunting our memory leak source, we can even go further and print all JavaScript objects that match a certain object property signature.

> fc431cd1::findjsobjects | ::jsprint

End of part 1. To be continued here.